
Projecting a New Perspective
Lecture Material
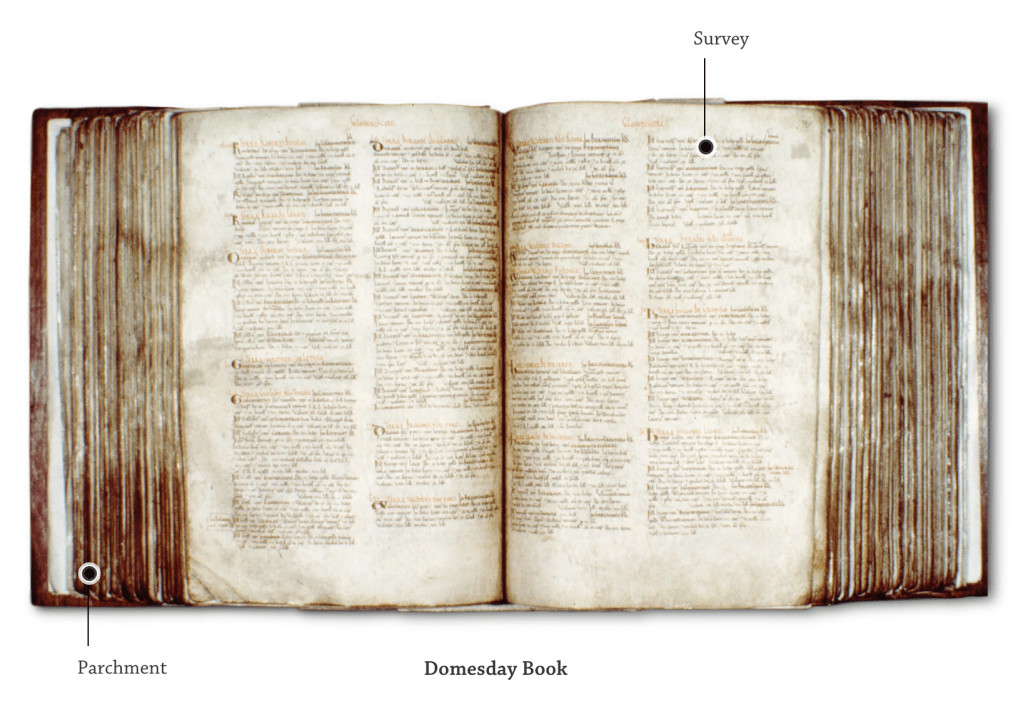
• 1086 AD Domesday Book; used to record land and who owned it (the landowners details), number of people, goods and animals – even disputes between neighbours. This is one of the earliest forms of surveys taken in book form, thought to have originated in 1085 by King William I of England:
• 1801 official country wide census, versus modern 2011 version
• Data is twisted in politics for their gain
• Donald Trump reeling off incorrect facts with data proving him wrong
• Distrust, causes fear and people to lie i.e immigrants
• Rise in data visualisation but shows no human tragedy; people like a story
“Which raises the question, in an era where we are saturated with diagrams, graphs, statistics and visualisation of information, how powerful are they really in telling a story and in changing public perception?”
• Banu Cenetogluh’s ‘The List’ publishes the truth and trauma of immigration. Contraversial as has been graffiti’d
• Charles Booth cartography exploring social classes in London
• UK police crime data, seemed as though good resource for public when released but quickly became evident it was for the police to track and predict crime locations
• Programs can be named ‘black boxes’ because important information to get to the final release is not displayed; therefore it is unknown if true or false
• ukdataservice.ac.uk
• AquaSata collects data about water resources and the environment
• Github page
• Local websites and community information
• National Archives historical public information
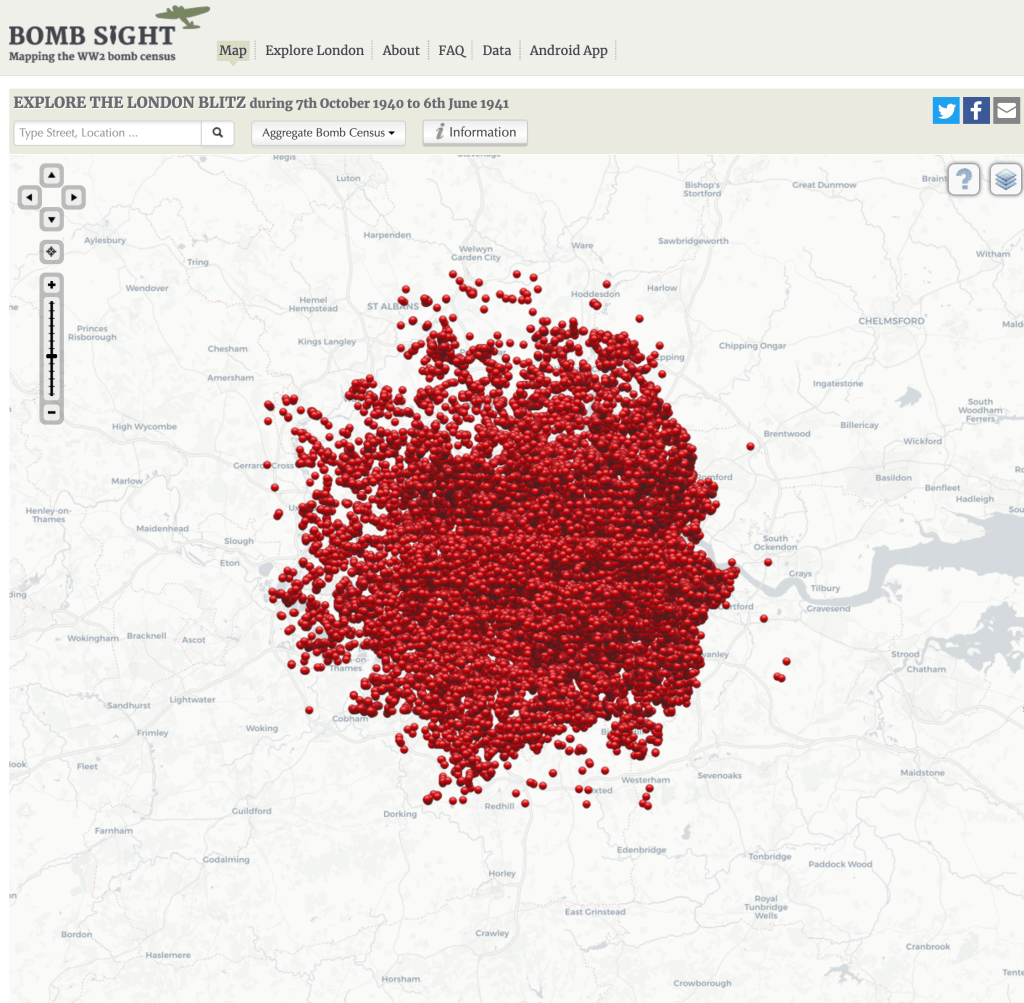
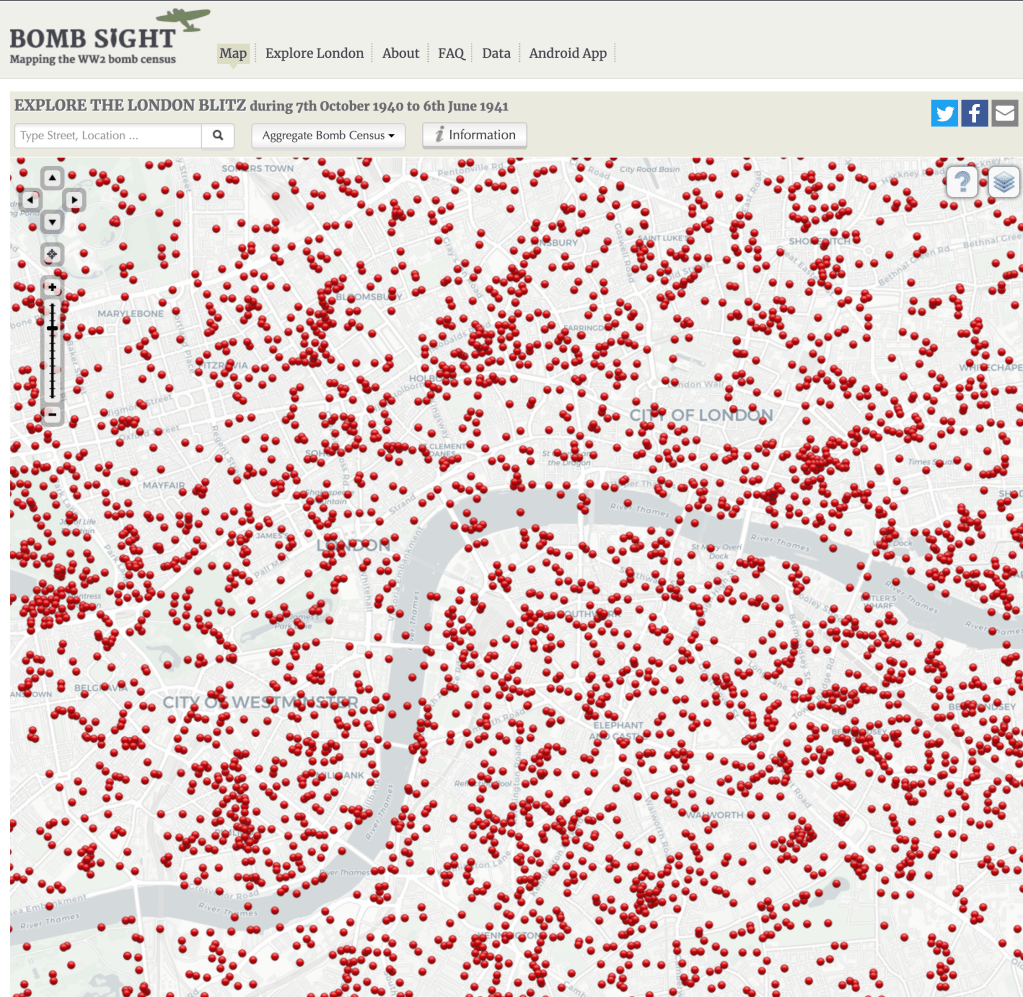
• Bomb sight project – data showing all of the WW2 bombs dropped in London:
• Forensic Architecture, independent research agency collect mass data and combine to create evidence of what happened
• Detecting body language, location, time, etc all play a part in building the event
• Future Lab, forecasting
• Applied data in layers, telling a story and become visually appealing
• Menashe Kashiman Fallen Leaves art installation with sound effects made by viewers walking over metal faces
• Jeremy Deller’s We Are Here project
• Black Shoal takes live data from the Stock Market

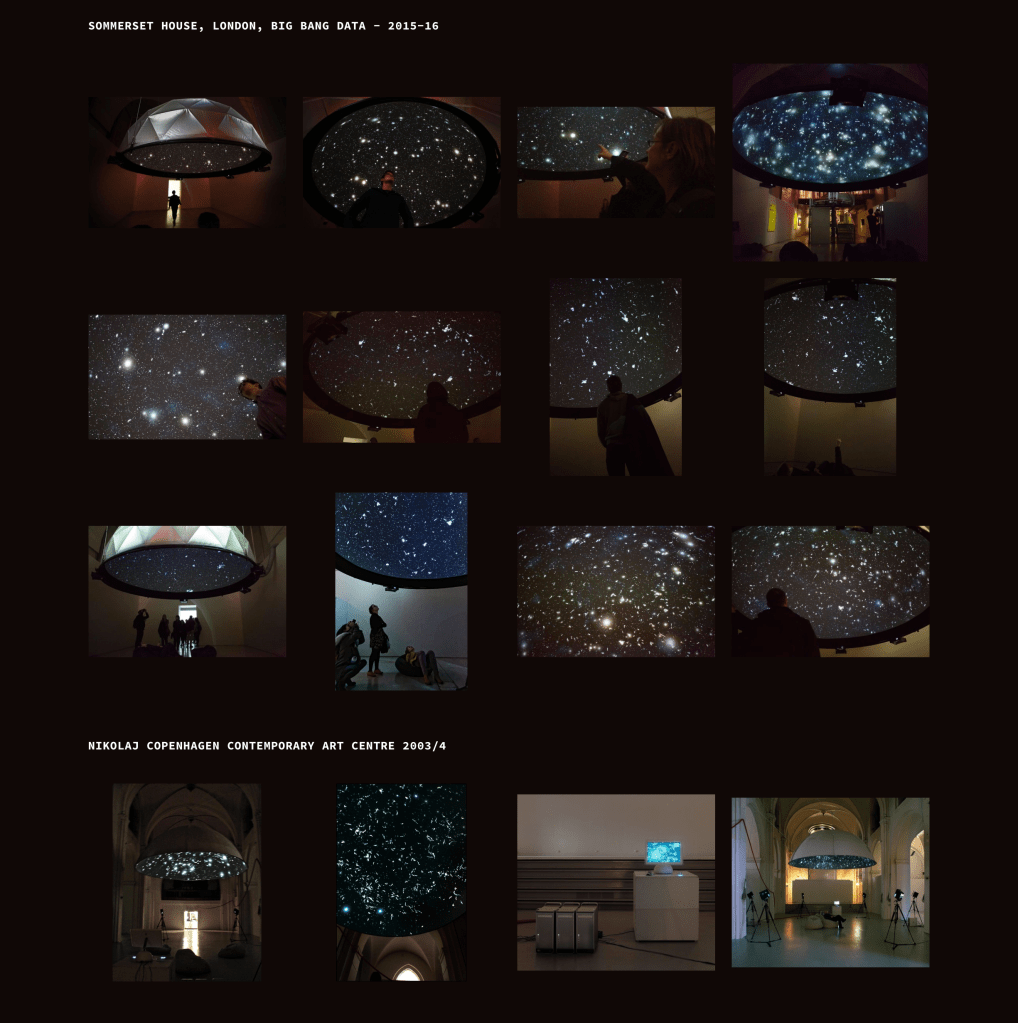
“In Black Shoals each traded company is represented by a star, flickering and glowing as shares are traded. The stars slowly drift in response to the complex currents of the market, while outlining shapes of different industries and the huge multinational conglomerates like the signs of the zodiac. The movement of the stocks is based on calculated correlations between the histories of each stock and those of its near neighbours. The stronger the correlation between the histories of the stock prices of any two companies, the more powerful the gravitational attraction between them. Although they start out randomly distributed in the planetarium, over time the stars clot together and drift into slowly changing constellations, nebulae and clusters. Through this technique different industries naturally start to emerge as galaxies. Any general disturbance in a section of the market will have a visible effect on the sky – the collapse of Enron, for instance, would have caused a sort of black hole – all the companies affected would glow very brightly due to the level of trading and would be pulled in to a single point in a very powerful vortex.” – Source
