
Reference Material
How Designers Measure Success (Part 1)
“…there should be an ample notion of the process by which the solution is going to be discovered (therefore bringing to the front the clarification of what the Design Thinking process actually is about), and also, and very importantly, how the process itself is going to be evaluated, based not only on the quality and validity of the solution, but also of the process itself (how it married the teams needs, ambitions, ownership, timeliness and cost effectiveness).”
“A successful Design Thinking engagement means strategically managing diverse points of view, but also being able to produce quantifiable and observable results, that are sensical with what was brought forth during the process, and that are representative of what is being attempted for clients/users and for the organization.”
The above has made me think about my project development and what measures are in place to measure its success. Essentially I can measure its success by evaluating my project against the following questions:
• Does the outcome encourage hands on craft and getting away from the screen?
Yes, the activities are designed to use stationery and natural resources such as nature, and not digital interfaces
• Is the outcome sustainable?
The brochure is made entirely of paper, with no ink being wasted in the margin areas. This would also keep the finances low as cheap to print, and it’s easy to package and transport which considers footprint. Also, the outcome would be printed with eco-friendly inks
• Is the outcome easy to use – would all graphic designers regardless of experience be able to use this brochure?
Definitely, the raw nature of the activities encourages play and basic principles in crafting such as, sketching, cutting out paper and sticking on the page
• Can the outcome be educational as well as a toolkit to reduce design related anxieties?
There is information about typefaces which I have included in the mock-up examples, but the toolkit would introduce the basic elements of design such as the grid, the rule of thirds etc. and be educational as well as a workshop journal
• Has the project purpose been considered in its identity and development?
The very nature of craft has been included in the design outcome, with myself scanning in mock-ups which have been written on, and feeding that back into the identity throughout the brochure. Small details such as hand-writing a typeface and using it as headings on pages, and even ripping up the letters that are in the brochure to create the cover itself titled ‘graphics workshop’
What is successful in my project?
The workshop brochure I have developed went through a design process that involved craft to enhance its identity and meaning. When beginning the project, I researched my audience which was really broad as ‘creatives’ in general. but soon realised I needed to define the audience to ‘graphic designers’ – at all the many stages in their careers, whether they are students or owners of design studios with decades of experience. I identified the main issues that graphic designers face nowadays through statistics and research; long hours spent at a desk staring at a screen is one, along with constant pressures, deadlines and creativity dissolving due to design related anxieties. I knew I needed to develop an analogue toolkit that would enable graphic designers to step away from the screen and fall back in love with hands on craft and creativity; thinking outside the box.
The research involved also enabled me to refine my concept and select the best areas for graphic designers to be creative in, projects which would be free of restrictions, not confined to time limits and can be expanded upon at later dates after the workshop independently. These areas are categorised as interaction, problem solving and collaboration. There are activities that tie in with each area, in order to improve delegates skills and explore their boundaries with a fresh perspective.
Researching current trends in the creative world such as journals, social media challenges, already existing workshops and studio projects in the graphic design industry has helped me conclude the identity of the brochure and how it will be designed. In order to encourage the hands-on craft, the brochure has been made suitable for manipulation, where the designers can tear-out pages and cut up, rip or scan in pages to achieve different outcomes. The workshop brochure needed to be fluid in its design so it would enable creativity to flow; with hints at quick scribbles, and sketches using mixed media to spark ideas for the activities. The main element behind this workshop brochure is that it actively encourages mistakes and more importantly, experimentation. Graphic designers need to branch out and expand their ideas during the development process in projects in order to get from one destination to the other. Without taking these steps, their outcome risks being un-informed and not on brief, as they haven’t explored all of the possibilities. This is subtly also introducing the delegates to the basic elements of design practice and in order for projects to be successful, graphic designers need to consistently re-evaluate and develop their ideas.
How Designers Measure Success (Part 2)
“Students learn the terminology, buzzwords, expressions, that indicate their exposure to the Interactive World in particular and the Design Thinking process in general, but the depth of knowledge is still somewhat shallow.”
I agree with this, and from my experience I learnt the exact same thing when starting my previous degree before this. The degree didn’t encourage experimentation and development like I have learnt from this course (which is one of the reasons I wanted to do it!). In order to grow as graphic designers, yes you need to to know the basics but you need to be consistently applying these rules and things you have learnt (very much like what the lecture material for this week mentions) in order to build upon your skills.
“Titles can however lack the subtlety to really demonstrate the breadth of knowledge and experience a professional brings to a role, which is why I typically answer professionals who want to progress to other roles and/or levels, to understand what the role is truly about, and if it indeed summarizes what their input/perspective is about.”
The above ties back to the notion that designers wear multiple hats – as its better to be able to do lots of things at a medium level than be an expert in one or two. Roles are becoming combined; a graphic designer is not just involved with typography anymore for instance, and actually touches on several areas of practice such as photography, branding, identity, logo design, typography layout in editorial design etc. This workshop brochure will present this message through providing tasks that enable growth and identification of personal strengths and weaknesses.
Quantitative experience – professionals who have been in the field a lengthy period of time and therefore have expertise
Qualitative experience – professionals who are exposed to a wide variety of industries, products and projects and communicate and understand what lies ahead and therefore is similar to showmanship or crafty sales pitches
Sensodyne Daily Care Toothbrush (2019)
This project is the development behind creating a toothbrush.
The document is broken down in the following areas which I could take note for my final outcome analysis (presentation):
Executive summary
Page 3
• The audience
• What exists in the market currently
• The problem
• Why the brand differs from already existing products
• How its more effective than already existing products
Case study overview
Page 4
• The solution/brief
• Research statistics backing up why this design is important
• Design specifics/requirements by the client
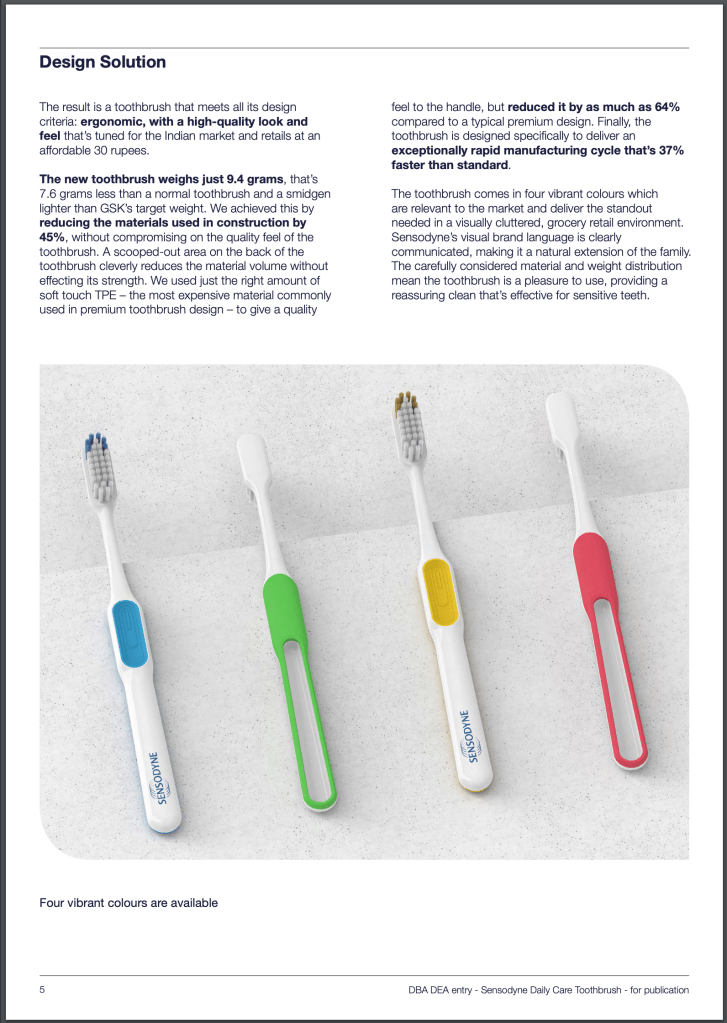
Design solution
Page 5
• The final outcome
• Addressing the quality that makes this product better than others in the market
• Other qualities and features i.e. 4 colours
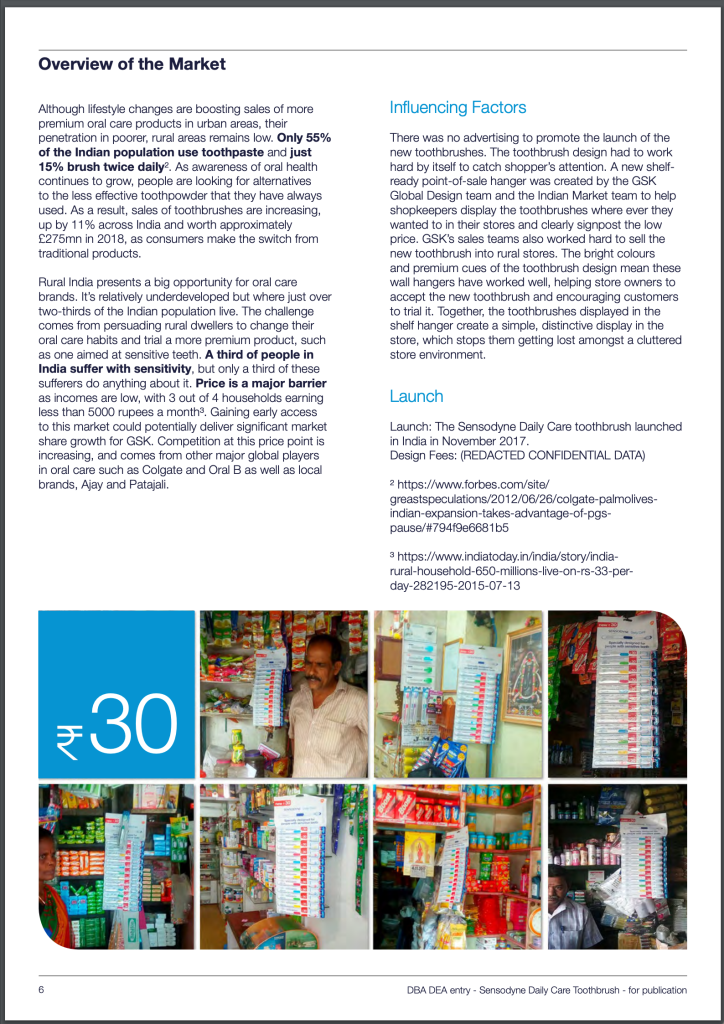
Overview of the market
Page 6
• Summary of the market and problem
• How new product is advertised in the market
• How was the product launched, press, documents
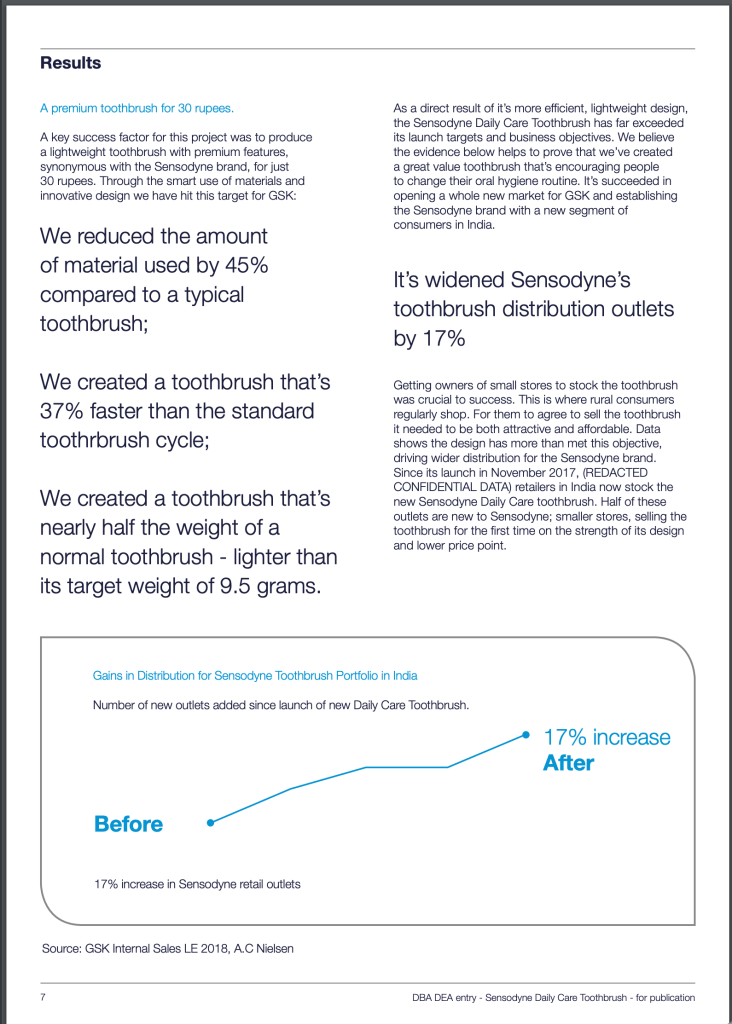
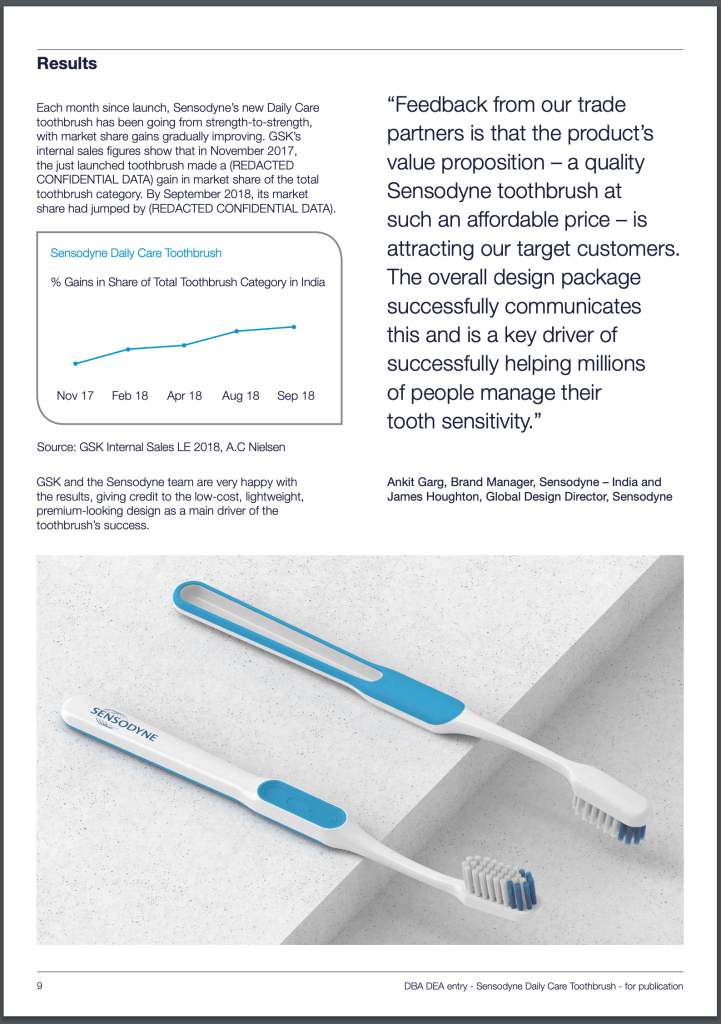
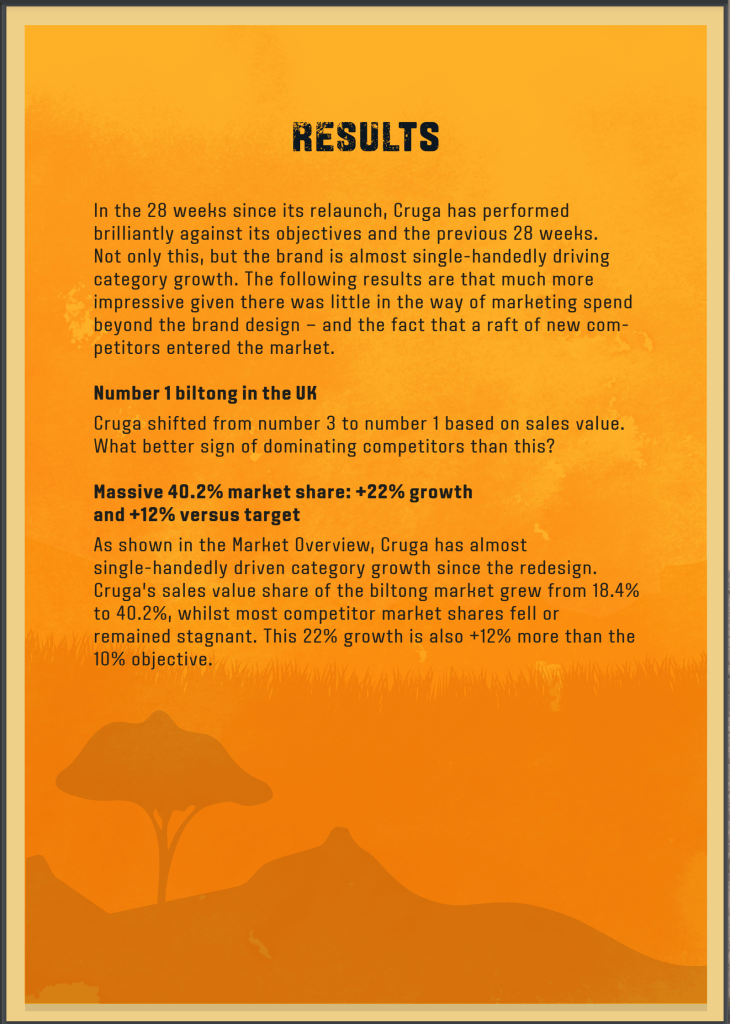
Results
Page 7
• Aftermath and impact, statistics supporting effective design
• How its affected the market and broadened the brand
• How consumers reacted to the product
• Comparison with the success of other market brands
• How the business plans to grow going forward
Pushing Through the Urge to Self Harm (2019)
This project is the development of an app, and there are some differences with the above Sensodyne PDF due to the output being in a different format. Measures are going to be different, so I noted down what the differences are:
Page 6 
Page 7 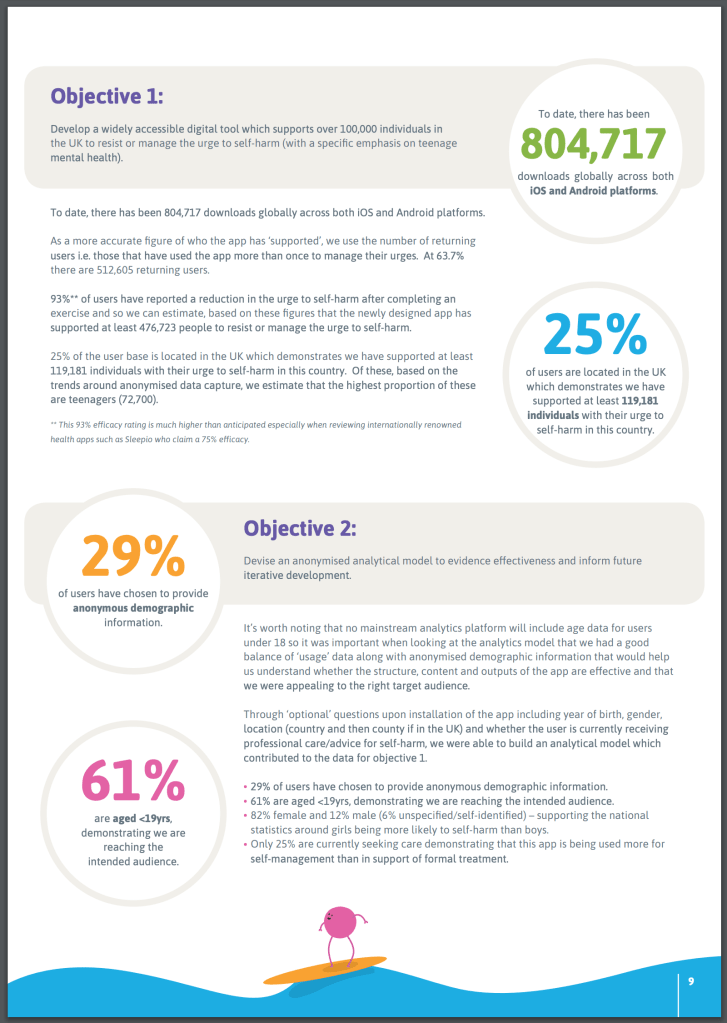
Page 8
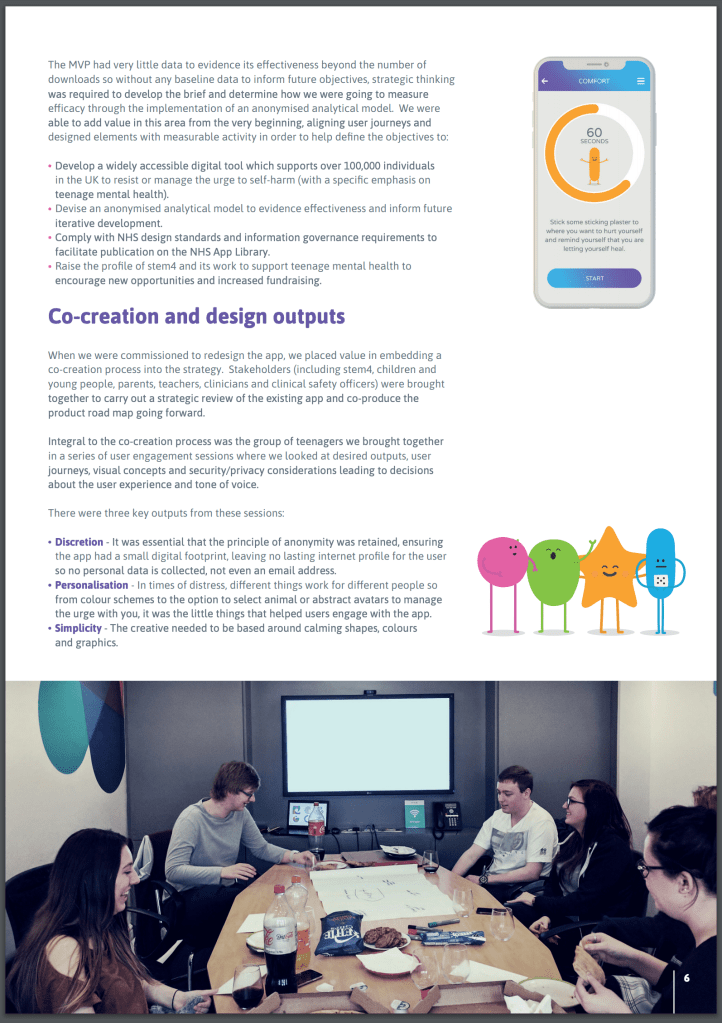
Co-creation and design outputs highlight the development and testing of the app in progress
Page 6
• Stakeholders were brought together to make a roadmap of desired outputs
• Exploring visual concepts
• Identifying the key traits the app needed (discretion, personalisation and simplicity)
Logo development and branding relating to the message
Page 7
• Branding is based on the message of ‘riding the wave’ and combat urges
• The logo development is shown in six thumbnails
Objectives were set to meet the brief criteria and make a succesful outcome
Page 8
• Objective 1 – develop the digital tool (app)
• Objective 2 – develop an analytical tool (for measuring the app)
• Objective 3 – distribute the outcome publicly (on NHS apps library)
Cruga Biltong (2019)
Very similar to those above, but have included:
Page 8 
Page 9 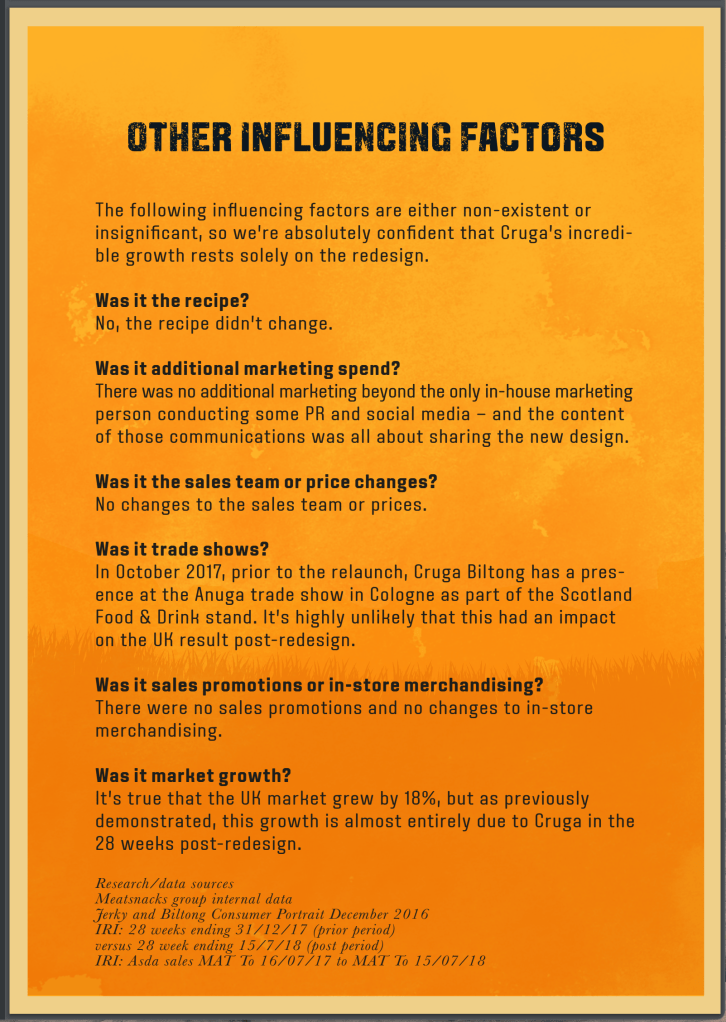
Page 10
Description
Page 5
• What the food product is
• How the branding forms identity
I’m not sure if I’ve missed it but I am reading all the statistics for this and not seeing actually how the statistics were measured? It’s clear they have developed the statistics in comparison to the old branding sales, but how have they measured and tracked sales? Some info on that would have been useful
